|
The 95% confidence interval that was right 0% of the timeHome / Email / CV / Google Scholar / LinkedIn / Github / Blog |

|
|
August 24, 2026 Last week I ran a nominal 95% confidence interval a hundred times against a ground truth I could compute exactly, to the sixth decimal place. It contained the truth in zero of the hundred runs. Not 80%, not 50%. Zero. And it came from bootstrap FQE (fitted Q-evaluation, which learns a value function from logged data, with intervals built by resampling that data), one of the estimators people treat as the sensible default when deciding whether an RL policy is safe to deploy.
The gap nobody had filledOff-policy evaluation (OPE) means estimating how well a new policy would perform using only data collected by an old one, without deploying the new policy. Every offline deploy/no-deploy decision ultimately rests on an uncertainty interval around an OPE estimate. So you would expect someone to have checked whether the intervals practitioners actually compute deliver their advertised coverage. The usual suspects: bootstrap intervals around importance sampling (reweighting old data by how likely the new policy was to take each action), fitted Q-evaluation (FQE, fitting a value function to the logged data), and doubly-robust hybrids (combining the model estimate with an importance-weighted correction). Coverage here means the plain thing: a 95% interval should contain the true value about 95% of the time. Mostly, nobody had. The big empirical studies never audit intervals: COBS compares roughly 30 estimators on point-estimate accuracy, and DOPE benchmarks value error and ranking metrics. The methods literature keeps proposing new interval constructions instead: high-confidence bounds (Thomas & Brunskill 2016), bootstrap corrections (Kostrikov & Nachum 2020), empirical-likelihood intervals (CoinDICE), and the conformal OPE line from 2022 onward (Taufiq et al. 2022; see also Foffano, Russo & Proutiere 2023 in that same line). One honest caveat up front: this is not the first coverage number ever published. Hao et al. 2021 embedded a coverage-vs-episodes study for their own bootstrap-FQE method and noted undercoverage at 10 episodes. What I could not find in an adversarial three-search sweep of 2022+ work is any paper whose primary contribution is a cross-estimator audit of the intervals practitioners currently use, with sample-size guidance attached. That sweep had limited recall (the OpenAlex queries were noisy), so if you know a paper I missed, please send it. The experiment: a world small enough to compute the truthThe whole design hinges on one choice: an environment where the true policy value is exact, so any interval failure is unambiguously the interval’s fault. I used a 5x5 slippery gridworld (slip probability 0.2, goal +1, pit -1, gamma 0.99, horizon 50). The target policy is a noisy greedy policy; the behavior policy that generates the data mixes in 30% uniform noise, with action probabilities known exactly, so importance weights are exact too. Ground truth comes from finite-horizon dynamic programming: V = 0.874020, cross-checked against 50,000 Monte Carlo rollouts (0.873701 +/- 0.000959, z = -0.33). 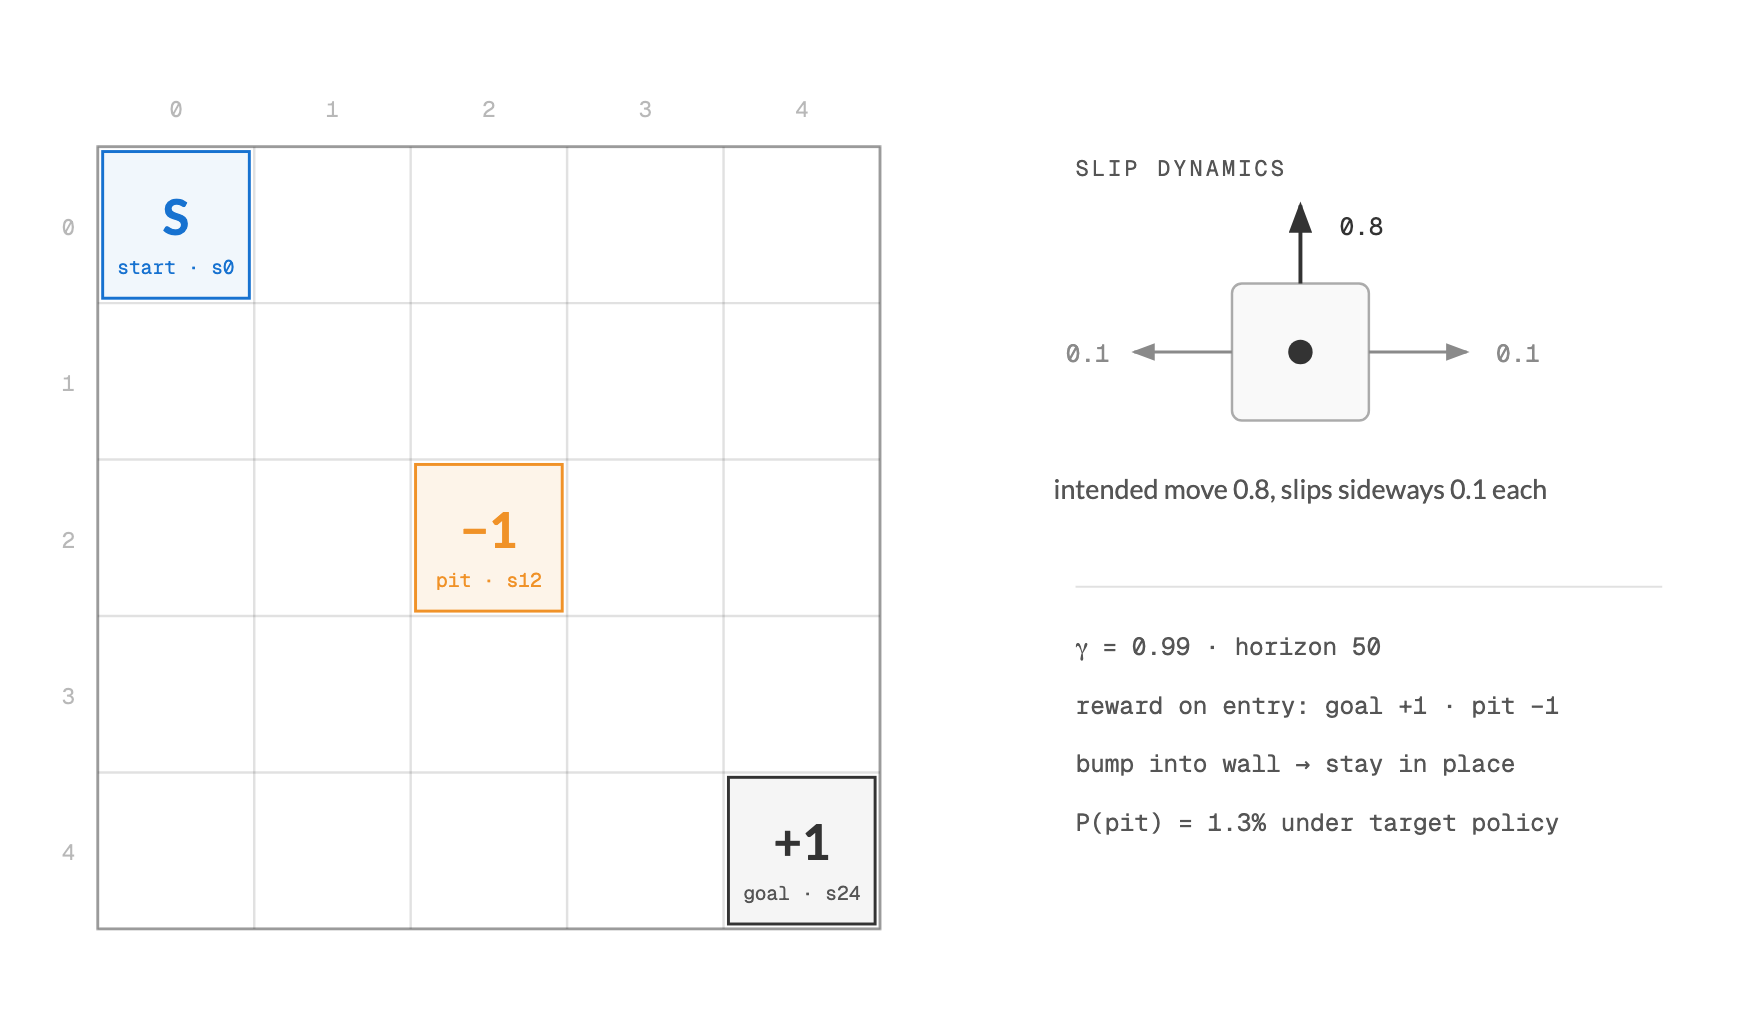
I made the return distribution deliberately safety-flavored: the target policy hits the pit 1.3% of the time, giving a skew of -8.3. Then: datasets of N in {10, 50, 200, 1000} behavior episodes, 100 independent replicates per N, four estimators (IS, WIS, DR, tabular FQE), percentile bootstrap (B=200) and normal-approximation intervals, plus an on-policy Monte Carlo baseline at matched budget. Monte Carlo error on each coverage number is about 2 to 3 points. The whole pipeline in one picture: the behavior policy generates the offline datasets along the top path, dynamic programming computes the exact truth along the bottom path, and the audit checks how often each estimator’s interval contains that truth. 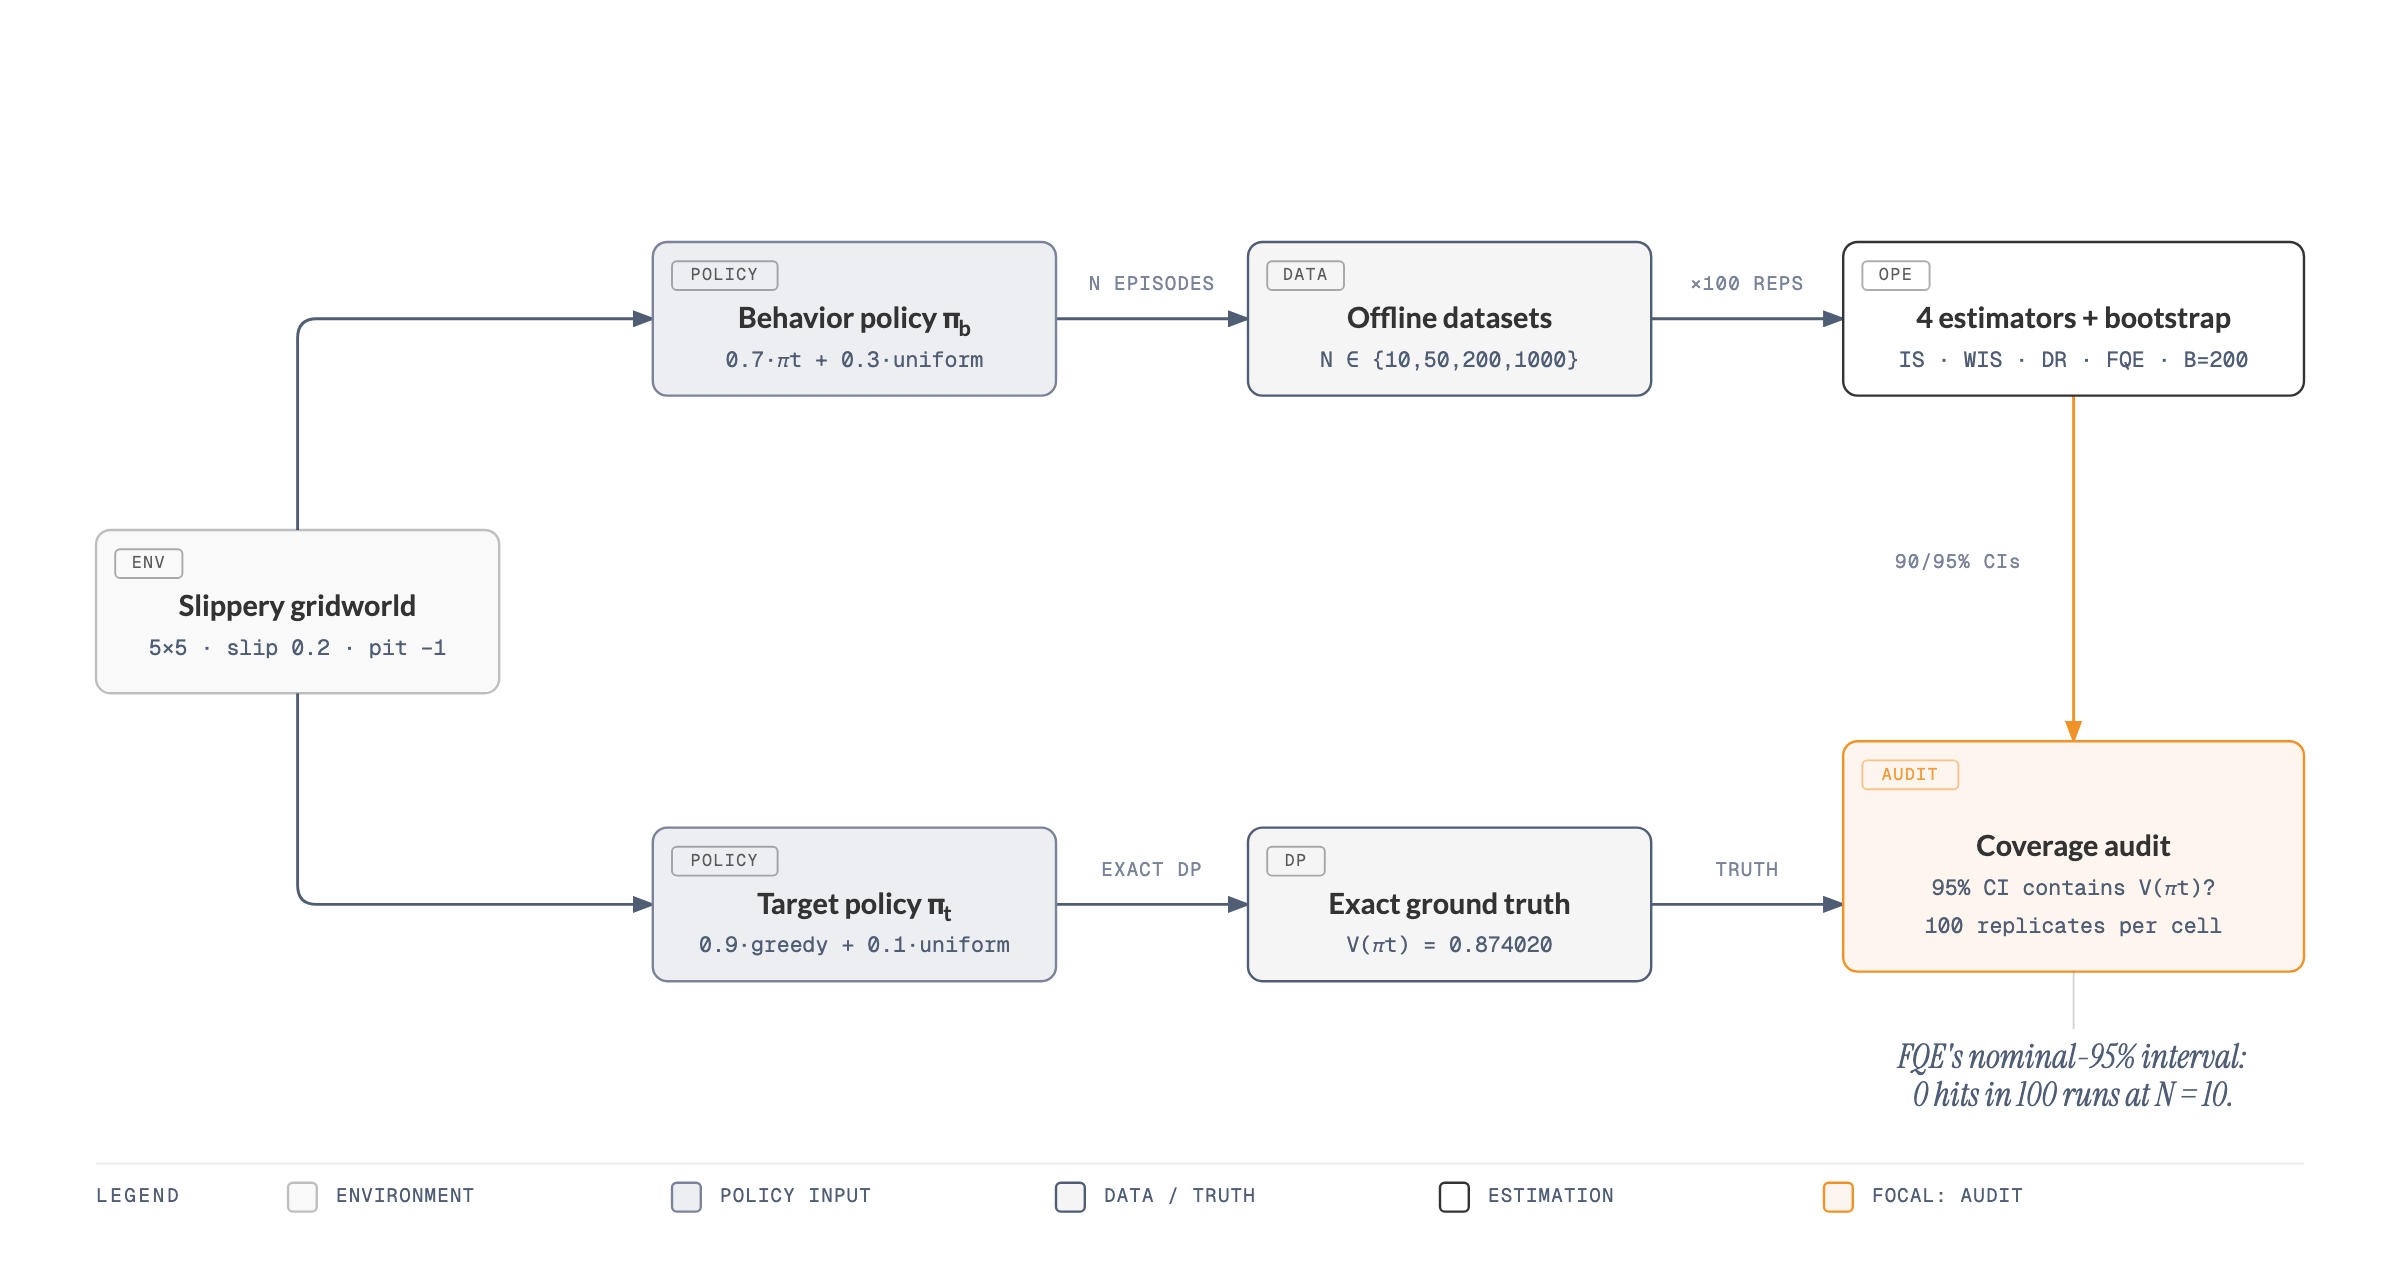
Empirical coverage of nominal 95% intervals:
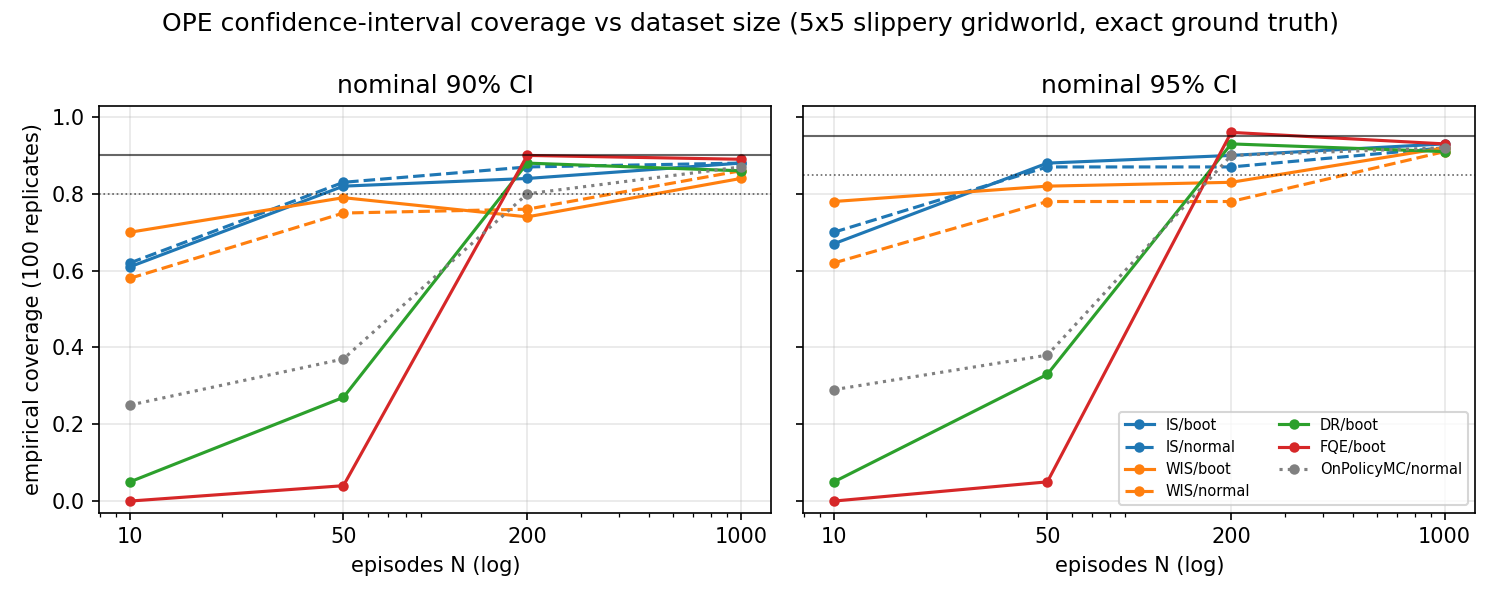
Not a single estimator-interval combination stayed within 5 points of nominal at all N <= 200. Under my pre-stated rule (miscalibration if any N <= 200 cell misses nominal by more than 10 points), miscalibration was demonstrated many times over. The FQE and DR collapse has a clean mechanism, and it is not heavy tails. With 10 episodes, most (state, action) pairs are never visited, and the fitted Q-function defaults them to zero. That produces a strong pessimistic bias in the point estimate (about -0.24 to -0.25) while the bootstrap, resampling the same blinkered data, produces narrow intervals around the wrong value. Confidently wrong is the worst failure mode an interval can have, and the “safe default” DR estimator was among the worst calibrated at small N. That was one of the surprises I had pre-registered as “would surprise me” in the plan, and it happened. Two more surprises. First, WIS (weighted importance sampling, which normalizes the weights to cut variance) was the only estimator still failing at N=200, sitting 12 to 17 points below nominal, after everything else had recovered. Low variance, persistent bias. Second, the honest complication: the on-policy baseline also failed at tiny N (0.29 and 0.38 coverage at N <= 10 and 50). With a 1.3% catastrophic event, small samples usually contain zero catastrophes, so every variance-based interval collapses around an optimistic value. The tiny-N failure is partly universal rare-event skew, not an OPE problem. The OPE-specific findings are the far more extreme, bias-driven FQE/DR collapse (0.00 to 0.05 versus 0.29 to 0.38) and WIS still failing at N=200 after on-policy has recovered. How many episodes before you can trust the intervalThe audit only earns its keep if it translates into guidance. N* is the smallest tested N where 95% coverage lands in [90%, 100%]: 200 episodes for bootstrap IS, DR, FQE, and on-policy MC; 1000 for WIS (both interval types) and normal-approximation IS. Note the grid: N* is resolved only on {10, 50, 200, 1000}, so the true thresholds sit somewhere between grid points. Width is where OPE redeems itself. Median 95% interval width relative to on-policy Monte Carlo at matched budget:
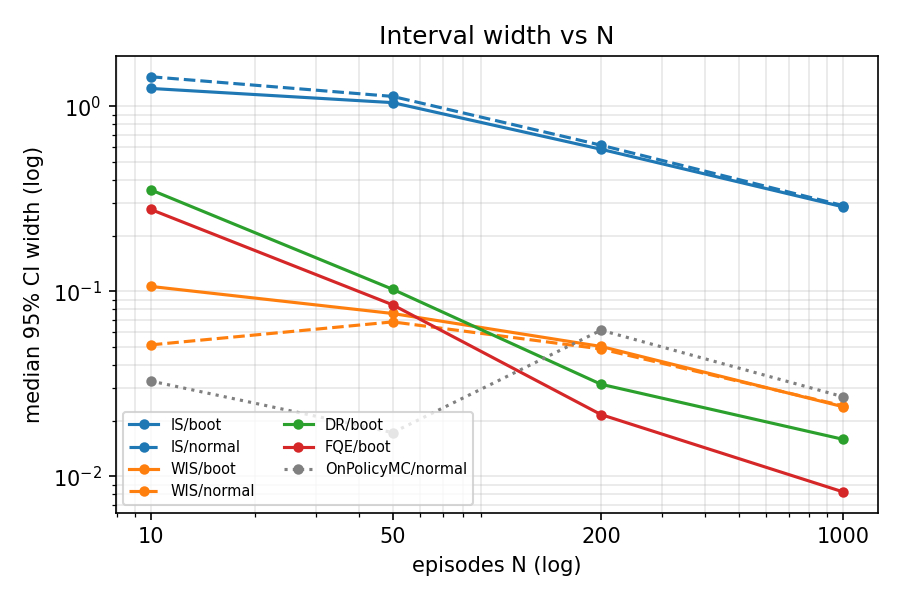
So the practitioner takeaway, scoped strictly to this toy task: below ~200 episodes, trust nothing. At 200+, prefer bootstrap FQE or DR; once calibrated, their intervals are 2 to 3x tighter than actually running the policy on-policy at the same episode budget. IS is calibrated at 200 but roughly 10x wider than just running the policy (honest but useless). Distrust WIS intervals until around 1000 episodes. What this does and does not showThis is a 25-state tabular world with exact importance weights, exact ground truth, and a hand-picked rare-event structure. Real offline RL has function approximation, estimated behavior policies, and estimated weights, none of which will make calibration easier. That is exactly why the framing is “even in the easiest possible setting, standard intervals fail at small N”: the failure here is a floor, not a ceiling. Add the N* grid coarseness and the limited-recall novelty sweep, and the right reading is “a confirmed, consequential problem on the easiest instance,” not a field-wide measurement. What’s nextThe obvious follow-up is the same audit at D4RL scale: continuous control, function-approximation FQE, learned behavior policies, with the deliverable being per-estimator N* tables a practitioner can actually use. Two backlog directions from this run also survived: anytime-valid stopping rules for policy certification (confidence sequences that answer “how many eval rollouts before I can certify this policy” without fixing N in advance), and testing whether formal robustness certificates on policy networks actually predict return degradation under distribution shift, which nobody appears to have checked empirically. Everything above is reproducible from the code on GitHub: two Python files (numpy and matplotlib only), fully seeded with MASTER_SEED=20260824, about 20 seconds on a laptop CPU. If a 95% interval can be wrong 100 times out of 100 in a world this small, it is worth 20 seconds to check yours. References
|
|
Checkout my other website hari.qpoch.com |